If I asked you to forget everything you know about beam profiling and come up with a way to take a “picture” of a laser, what comes to mind? The most obvious answer is to use a camera to take a picture. CCD and CMOS cameras are indeed some of the most common types of laser beam profilers in use today.
A much less obvious solution would be to take a tiny window, or slit, and rotate it to take small samples of different parts of the laser beam – i.e., use a scanning slit profiler. This works too, but it seems a little convoluted. Is this really necessary or is Photon just trying to fix something that’s not broken?
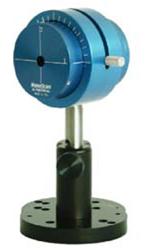
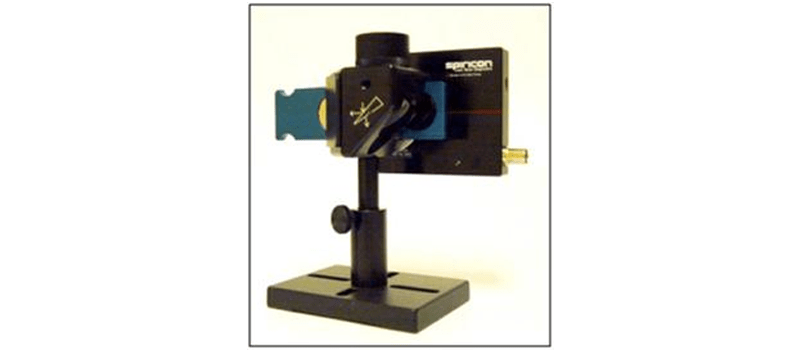
I’ll be the first to admit that every beam profiler has its own pros and cons and one must get the best profiler for his particular application. (If you’re not sure what’s best for you, we encourage you to check out our Beam Profiler Wizard.) This being said, there are quite a few reasons to opt for a scanning slit beam profiler such as Photon’s NanoScan:
- First and foremost is its natural attenuation. When using most other beam profilers for high power laser beams, one must purchase additional attenuators so the laser doesn’t fry the detector. Because of the nature of scanning slits’ spinning measurement, the detector is exposed to only a bit of the beam at any given time. This means that only the very highest power laser beams need attenuation, while anything else can be measured directly with the NanoScan beam profiler.
- Partly because of this “natural attenuation,” NanoScan boasts a 35dBpower dynamic range. This means the power range of this instrument is 3.5 orders of magnitude (This refers to the single acquisition dynamic range. See the clarification below for the full dynamic range, which varies per head.)
- NanoScan can be used with a corresponding detector to measure any laser from UV to FIR (past 100μm).
- NanoScan can even measure high frequency pulsed lasers. This is a great alternative to the expensive camera profilers needed for IR laser measurement.
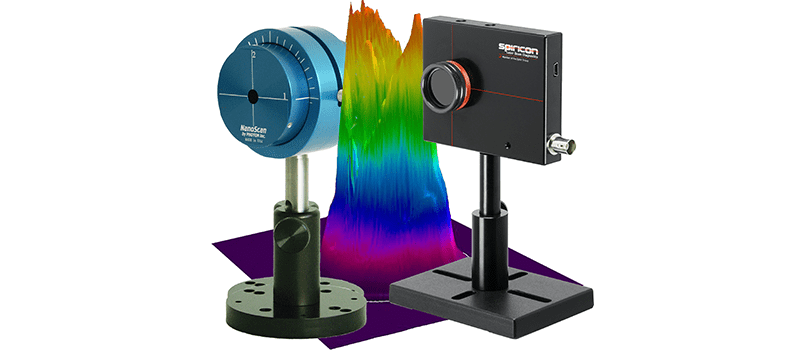
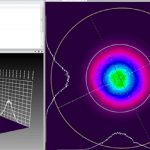
- NanoScan recently released a new version of the software that comes along with its profiler heads. This new GUI provides an excellent graphical interpretation of your laser beam, in 2D or 3D. You can also read the press release or datasheets for the new NanoScan software.
If you’d like more background information on the scanning slit profiling method, I recommend reading this introduction or one of these tutorials.
So, now that you’ve remembered everything you know about beam profiling, what do you think?



Clarification: 35 dB Power is the single acquisition dynamic range. With amplifier gain changes, the total instrument dynamic range for NanoScan is far greater. It is 35+62=97dB for the Silicon scanhead,35+37=70dB for Germanium, and 35+43=78dB for Pyroelectric!
Much thanks to our Director of Technology, Jeff Guttman, Ph.D., for clearing up this issue. A small note has been introduced into the original text directing readers to his clarification.